
Since early 1991, the Federal Reserve Bank of St. Louis has offered a wealth of authoritative data useful to valuation professionals, currently accessible through its online FRED database (located at http://research.stlouisfed.org/fred2/). FRED is valuable for both valuators who perform only a handful of engagements each year and those who need access to its unique breadth of underlying economic data.
FRED provides access to national, and regional data series, including data from the:
Data from these and numerous other sources can support several parts of the valuation process, including:
With FRED, valuators can go to a single location to find a wide variety of reliable macroeconomic data that streamlines their workflow while fortifying their conclusions.
FRED offers more data than most valuators will ever need. The key is knowing where to look, and the website features several ways to jumpstart your search.
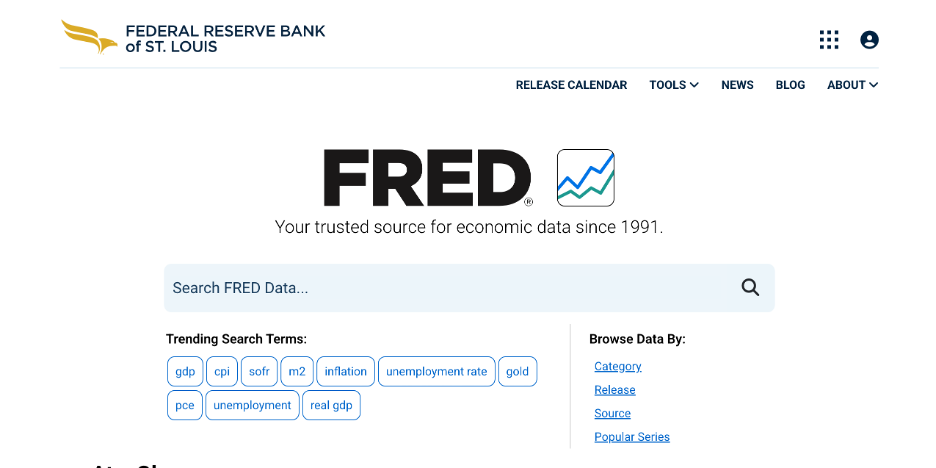
From the homepage, you can search for data by entering a search term or browsing the data by:
FRED also includes easy-to-use tools to produce visualizations and the ability to save, share, and store data so you can come back to it later.
Using the Excel Add-in
Valuation professionals can manually download FRED data and use the free Excel add-in to create a workbook they can reuse and refresh. The add-in makes much of business valuators’ work with economic and industry data faster and more repeatable.

How does it work? Each FRED series has a unique series ID. Once the desired IDs are entered in the worksheet, the add-in retrieves the data directly into Excel. It can also:
The add-in’s dataset mode can align multiple series into a common table, enabling you to create comparison charts and connect economic data with a subject company’s historical results.
Use Case Example: Guideline Company Analysis
Assume a subject company grew revenue by 4%, while the selected guideline companies grew by 9%. That difference could indicate that the subject is losing market share. It could also reflect differences in geography, customer base, product mix, acquisitions, or industry exposure. FRED can help place the disparity in context.
You could compare the subject and guideline companies with data series on:
FRED’s GDP-by-industry collection includes hundreds of series covering industry output, value added, intermediate inputs, and real growth. It also contains thousands of industry-specific Producer Price Index series that can help a valuator assess whether revenue growth may be attributable partly to industry price increases rather than increased sales volume.

This information doesn’t replace the application of the valuator’s judgment in the comparison of the subject and guideline companies. But it provides independent evidence that can help explain differences among them.
Use Case Example: Validating Forecast Assumptions
FRED can also help you identify periods in which the company performed significantly above or below broader industry or economic trends. For example, you could compare historical company revenue with series related to:
This could help you determine whether management’s assumptions are reasonable, as well as identify periods in which the company performed significantly above or below its competitors.
Sample Valuation Workflow with FRED
A practical workflow might look like this:
1. Identify the subject company’s economic drivers.
This could include a combination of, for example, its industry, customers, geography, major inputs, labor needs, and dependence on credit.
2. Search the FRED website for relevant series.
Review each series’ source, units, frequency, seasonal adjustment, release date, methodology, revision policy, and any copyright or attribution requirements. Record the series ID for each appropriate measure.
3. Add the series IDs to your Excel spreadsheet.
Use the add-in to retrieve the appropriate history and convert the data to monthly, quarterly, or annual periods as desired.
4. Compare the data with the subject company.
Review operating indicators like growth rates, margins, unit volume, and employment. Determine whether the company’s performance is consistent with the market.
5. Incorporate the findings into the valuation narrative.
Use the data to explain forecast assumptions, guideline company differences, economic conditions, and the selection or weighting of valuation methods.
The result shouldn’t be a collection of generic economic charts. Each series should help answer a question relevant to your valuation.
A Caveat about Timing
Economic data is frequently revised. FRED generally displays the most recently available observations, including revisions to previously published data, even when earlier observations have subsequently changed.
For a current valuation, that may not present a problem. For a retrospective valuation, litigation assignment, or another analysis governed by information known as of a historical date, it might.
In those circumstances, you can turn to ALFRED (ArchivaL Federal Reserve Economic Database). ALFRED preserves historical vintages of many economic series, allowing you to retrieve the data that were available on a particular date.

The Bottom Line FRED is a powerful way to bring credible economic and industry data directly into your workflow and directly into your spreadsheets. For valuators who need this level of detail and breadth of economic data, FRED is an indispensable resource.

